
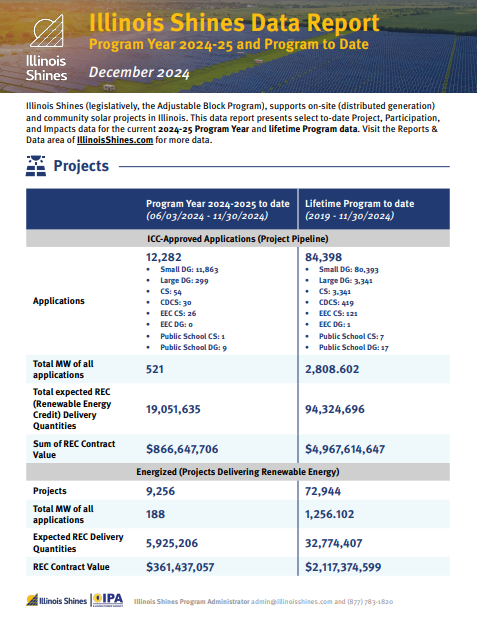
 Projects
 Participation
 ImpactsProjects
| Program Year 2026-27 to date (06/01/2026 – 09/30/2026) | Lifetime Program to date (2019 – 09/30/2026) | |
|---|---|---|
ICC-Approved Applications (Project Pipeline) | ||
| Applications | 5,471 • Small DG: 5,323 | 121,640 • Small DG: 116,357 |
| Total MW of all applications | 277.96 | 4,450.66 |
| Total expected REC (Renewable Energy Credit) Delivery Quantities | 9,571,304 | 154,281,175 |
| Sum of REC Contract Value | $430,840,923 | $7,572,284,690 |
Energized (Projects Delivering Renewable Energy) | ||
| Projects | 6,371 | 108,503 |
| Total MW of all applications | 202.62 | 2,110.03 |
| Expected REC Delivery Quantities | 6,415,707 | 58,224,334 |
| REC Contract Value | $305,546,283 | $3,511,635,424 |
Participation| Program Year 2026-2027 to date (06/01/2026 – 09/30/2026) | Lifetime Program to date (2019 – 09/30/2026) | |
|---|---|---|
Participating Vendors | ||
| Approved Vendors (AVs) | 136 (New this Program Year) | 1,003 (Total Registered Vendors) |
| Designees | 54 | 905 |
| Equity Eligible Contractor (EEC) AVs | 1 | 102 |
| EEC Designees | 0 | 38 |
| EEC Subcontractors | 8 | 58 |
| Small and Emerging Businesses | 15 | 15 |
Minimum Equity Standard (MES) Compliance Data | ||
| MES Combined Compliance (PY 2026-27) and Year-End Reports (PY 2025-26) received | 822 | N/A |
Impacts| Program Year 2026-2027 to date (06/01/2026 – 09/30/2026) | Lifetime Program to date (2019 – 09/30/2026) | |
|---|---|---|
| Homes and businesses benefiting from approved Program projects* | 38,249 | 525,681 |
| Schools with on-site solar** | 13 | 141 |
| Percentage of Illinois counties with solar projects developed via Program | 96% | 100% |
* This number is the sum of Distributed Generation applications and an estimated number of subscribers to Community Solar projects.
** This number includes applications in the Public Schools category and applications that do not participate in the Public Schools category but have answered “Yes” to the “Is the project located on Public School owned land?” question in the Part I Application.